Blog 001: Graduates of Programs Subscribing to the NCLEX® Program Reports Perform Better on the NCLEX® Examination than Non-Subscribing Programs

The NCLEX® Program Reports are PDF Reports which provide a detailed description of the performance of a nursing program’s graduates on the NCLEX-RN® and the NCLEX-PN® Examinations. Mountain Measurement set out to assess the impact of the NCLEX® Program Reports for subscribing programs by conducting a series of research studies exploring the relationship between NCLEX® Program Reports usage and NCLEX® Examination performance.
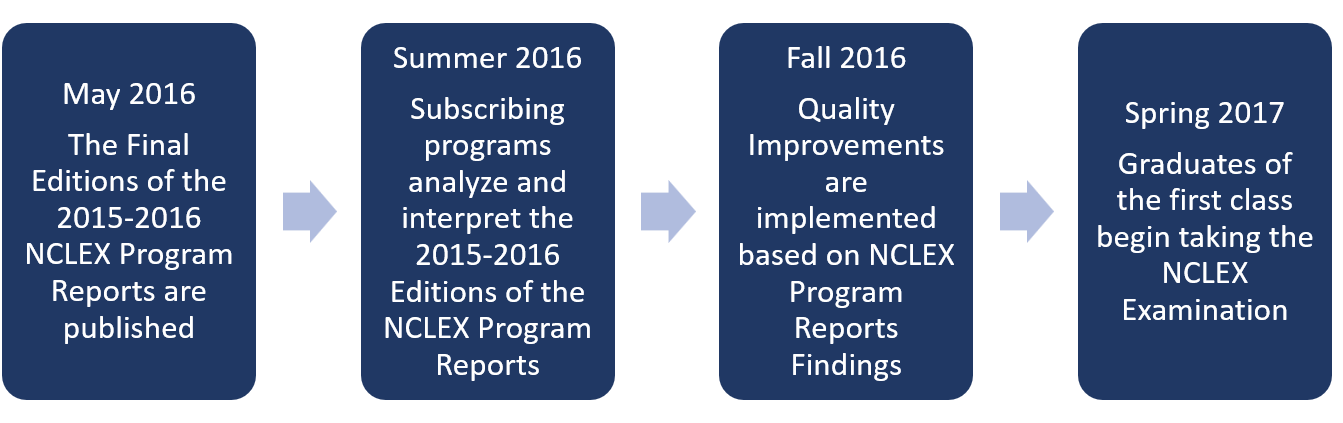
The Annual Edition of the 2015-2016 NCLEX® Program Reports was published in May of 2016. Proactive subscribing programs would have analyzed and interpreted this Edition during the Spring and Summer of 2016 after which they may have implemented quality improvements based on that analysis during the 2016-2017 academic year. The vast majority of students graduating at the end of that academic year, sat for their NCLEX® Examination between April 1, 2017 and Mar 31, 2018.
Figure 1. Timeline of Events Pertaining to NCLEX® Program Reports Usage and Graduate Performance
Methods
The 2017-2018 NCLEX® Examination passing rates for all nursing programs in the US were compared based on their subscription status to the 2015-2016 NCLEX® Program Reports. Only programs that had at least 10 graduates complete the NCLEX® Examination between April 1, 2017 and March 31, 2018 were included in the analysis. Over 90% of the programs had at least 10 graduates complete the NCLEX® Examination during that timeframe (See Table 1). Analyses were conducted by nurse type (RN and PN) and then by program type (PN, RN-ADN, RN-DPN, RN-BSN).
Table 1. Count of nursing programs by number of graduates (Over 10 vs. Under 10) taking the 2017-2018 NCLEX® Examination by 2015-2016 NCLEX® Program Reports subscription status.
| Subscriber | Non-subscriber | ||||
| Program Type | Statistic | Over 10 | Under 10 | Over 10 | Under 10 |
| PN | Count | 363 | 39 | 799 | 245 |
| Percent | 90.3% | 9.7% | 76.5% | 23.5% | |
| RN-ADN | Count | 708 | 20 | 458 | 126 |
| Percent | 97.3% | 2.7% | 78.4% | 21.6% | |
| RN-DPL | Count | 26 | 3 | 14 | 8 |
| Percent | 89.7% | 10.3% | 63.6% | 36.4% | |
| RN-BSN | Count | 543 | 14 | 307 | 58 |
| Percent | 97.5% | 2.5% | 84.1% | 15.9% | |
Independent Samples t-tests were conducted in order to compare the 2017-2018 NCLEX® Examination passing rates of programs that had subscribed to the NCLEX® Program Reports to those programs which had not subscribed. An Independent Samples t-test is used for determining the significance of the difference in the means of independent groups: in this case, the means of the passing rates for the subscribing group and the non-subscribing group. (Freedman, Pisani, and Purves, 1978). Separate analyses were conducted for each nurse type and program type.
Results
The distribution of 2017-2018 NCLEX® Examination passing rates for subscribing and non-subscribing programs are displayed via the histograms in Figure 2. For both nurse types, subscribing programs had higher passing rates than non-subscribing programs. Independent samples t-tests revealed that subscribing programs had a significantly greater NCLEX® Examination passing rate than non-subscribing programs. See Table 2.
Figure 2: Histogram of the distribution of the 2017-2018 NCLEX-PN® and NCLEX-RN® passing rates for subscribing and non-subscribing programs.
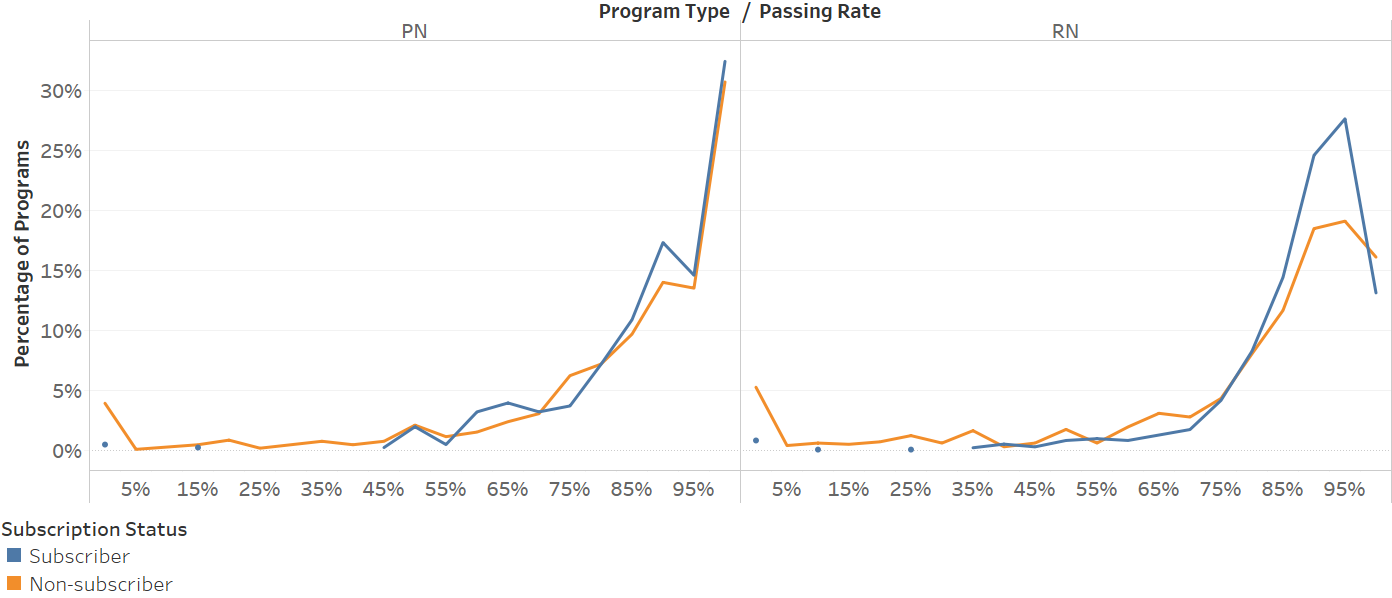
Table 2. Independent samples t-tests on the differences in 2017-2018 NCLEX® Examination Passing Rates for subscribing programs and non-subscribing programs for each nursing program type.
| Subscriber | Non-subscriber | ||||||||
| Nurse Type | Avg | St Dev | N | Avg | St Dev | N | t-test | d.f. | p-val |
| PN | 88.65 | 12.04 | 363 | 85.12 | 16.87 | 799 | -3.60 | 1160 | < 0.001 |
| RN | 88.93 | 10.42 | 1277 | 84.77 | 17.67 | 779 | -6.73 | 2054 | < 0.001 |
In order to further explore the differences between subscribing programs and non-subscribing programs, passing rates on the 2017-2018 NCLEX-RN ® Examination were examined by program type (Associate’s degree in nursing (ADN), Diploma in Nursing (DPL), and Bachelor’s Degree in Nursing (BSN)) using a box-and-whisker plot.
A box-and-whisker plot (Tukey, 1977) is a method of displaying data that highlights the median, interquartile range (IQR), and the data outliers. Each gray-shaded box encloses the IQR, such that the ends of the box represent the first and third quartile and the line where the two shades of grey meet represents the median. The whiskers that extend beyond the box represent 150% of the IQR, and each dot represents a program at that passing rate. See Figure 3.
Figure 3. Box and whisker plot of the 2017-2018 NCLEX-RN® Examination Passing Rates for subscribing programs and non-subscribing programs for each nursing program type.
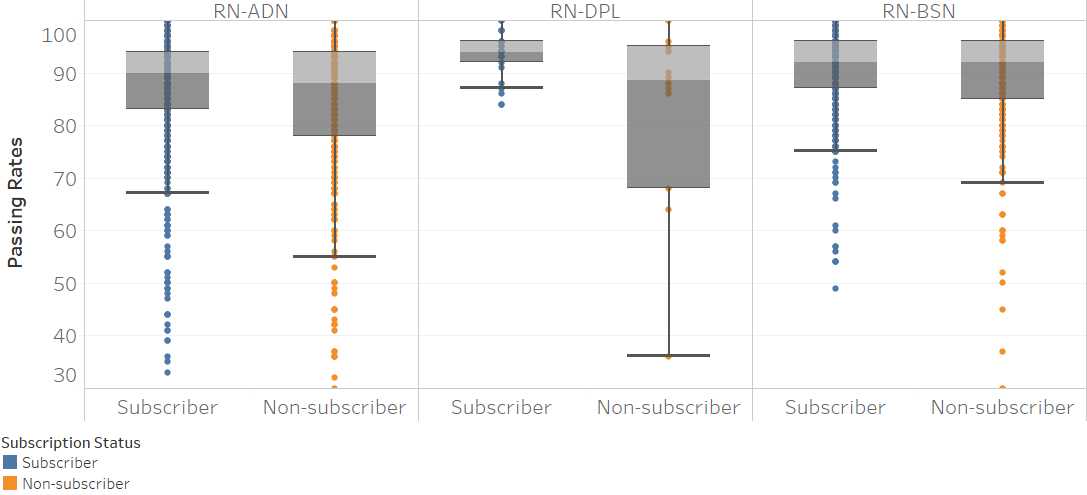
It is clear from Figure 2 that across all three RN program types, programs subscribing to the 2015-2016 NCLEX® Program Reports had higher 2017-2018 NCLEX® Examination Passing Rates than non-subscribing programs. In order to determine the significance of these differences, a set of independent samples t-tests were conducted. These results are reported in Table 3.
Table 3. Independent Samples t-tests on the differences in 2017-2018 NCLEX® Examination Passing Rates for subscribing programs and non-subscribing programs for each nursing program type.
| Subscriber | Non-subscriber | ||||||||
| Nurse Type | Avg | St Dev | N | Avg | St Dev | N | t-test | d.f. | p-val |
| PN | 88.65 | 12.04 | 363 | 85.12 | 16.87 | 799 | -3.6 | 1160 | < 0.001 |
| RN-ADN | 86.97 | 11.9 | 708 | 81.38 | 20.24 | 458 | -5.93 | 1164 | < 0.001 |
| RN-DPL | 93.65 | 4.63 | 26 | 79.36 | 24.78 | 14 | -2.88 | 38 | 0.003 |
| RN-BSN | 90.24 | 8.03 | 543 | 88.97 | 11.06 | 307 | -1.93 | 848 | 0.027 |
Discussion
This study investigated the relationship between NCLEX® Examination passing rates and NCLEX® Program Reports subscription status. The results clearly indicate that subscribing programs outperformed non-subscribing programs. However, these results should be interpreted with caution. The methodological design of this study was not sufficient to make causal interpretations about the impact of subscribing to the NCLEX® Program Reports on NCLEX® Examination performance. It is possible that the significant differences noted in the study are the result of a resource effect meaning that programs with more financial resources subscribe at a higher rate, invest more money into their program, and perform better as a result of the additional resources rather than their usage of the NCLEX® Program Reports.
Future studies into the relationship between NCLEX® Examination performance and the NCLEX® Program Reports should focus on usage. Every year, Mountain Measurement administers a survey to elicit feedback from NCLEX® Program Reports subscribers. Survey participants have the opportunity to indicate how much time they spent using the NCLEX® Program Reports. Although not all subscribing programs complete the NCLEX® Client Survey, the sample is typically more than sufficient for credible analyses. Future studies should use these data to examine the relationship between time spent using the NCLEX® Program Reports and NCLEX® Examination performance.
References
D.A. Freedman, R. Pisani, and R.A. Purves. Statistics. W.W. Norton, Inc. New York (1978).
Tukey, J. W. "Box-and-Whisker Plots." in Exploratory Data Analysis. Reading, MA: Addison-Wesley, pp. 39-43, 1977.
Continue reading this article
Sign up for a free account to access the full blog post and more.
Create Free Account Already have an account? Log in